Tuesday 29 September 2009

Kona-bound!

Tomorrow we're headed for Kona, an 20-hour flight from the UK with one stopover on the way. We'll arrive there at 8pm where it will feel like 8am to our GMT brains and bodies... ugh.

But I'm finally just about packed and getting quite excited about going. Hot weather, bright sunshine, new sights to see and food to eat. And the race of course! No matter what happens, you only do Ironman Hawaii for the first time once, so I'm looking forward to a great day.

The TrainingPeaks folks recently asked if I'd like to be featured on their blog and of course I said yes. The timing couldn't be more perfect as I didn't have time to write a proper post for my own blog this week. So for anyone who wants to know more about me, my background and why I do triathlon (plus some insights to what I'll be doing next season), check it out!

Next post from Hawaii with pics!

Wednesday 23 September 2009

Peaking and Tapering, Part III (the triathlete's dilemma)

Having written Part I musing over my taper for Ironman Lake Placid, and Part II about how I was going to fix this problem for Ironman Kona, I recently stumbled upon some important information leading me to post Part III: the triathlete's dilemma. Thanks to the Endurance Nation folks for starting this discussion (maybe it will get moved to a Hall of Fame thread so the public can read it too) and to Russ Cox for helping me out by analysing his own numbers. In fact, I'm looking forward to meeting up with Russ in Kona for an evening of number-crunching geekiness as we try to work out how and why a good taper works.

The dilemma is this: in triathlon, you do three sports. At the Ironman level, I think we can assume most people swim a reasonable amount but not enough to have a severe impact on their training stress. Huge amounts of swimming just aren't a good return on investment for time spent training vs. time gained in the race. So that leaves us with cycling and running. Running tends to be harder on the body, requiring more recovery for most people after intense or long workouts. Cycling can be done in larger volumes and for longer periods at a time, as the impact on the joints is not as great. Thus the fatigue and associated recovery time from running is likely different than the fatigue and recovery from cycling. So the question is, why do we measure ATL (fatigue) on the same scale for both cycling and running? And more importantly, why would you want to pay much attention to a combined Training Stress Balance when that could hide vast differences in fatigue between the two? The answer is, you don't.

Once I had this "a-ha" moment, I looked back at my IMLP taper and sure enough, my TSB was +33, but that consisted of a bike TSB of +26, while the run TSB was a mere +7. In other words, no wonder my legs felt fatigued out there, my run was not nearly tapered enough! Too much running in the week or two leading up to the race led to this, which was caused by my blindly following my plan without thinking that my mileage up to that point had actually been below what the plan called for. Running 3-4 hours a week in training, then tapering by running 2-3 is not that smart. But low-mileage running is a topic for another post.

I haven't found much information yet on the "ideal" CTL, ATL and TSB numbers for the run vs. the bike in Ironman tapering (though digging through the Google Wattage list and other blogs has got me a bit closer to understanding it), but using Russ's numbers it looks like a run TSB of +15 or so worked for him. I'm aiming for a +12 on race day. I've also adjusted my run ATL to a 10-day constant rather than 7-day as I have on the bike. Wary that I backed off too much on the bike for IMLP, my bike TSB on race day in Kona will be +19 and I'm trying to limit my CTL losses to 13-14%.

See my charts below for the way it's going to look. Note that my TSB will be steadily climbing, rather than seesawing as it did for IMLP, and likewise my ATL and CTL steadily falling. And apologies for mixing and matching Performance Management charts from both SportTracks and WKO+. I finally spent a painstaking evening putting all my workouts between now and Oct. 10 into WKO+ and messing with the length/intensity of each to get what I believe now is a more ideal TSB. So the charts below reveal my new numbers:

run
TSB+12, CTL 37 to 30 for a loss of about 20% (that loss is perhaps still a bit high? but again, my run volume in general has been low compared to the intensity)

bike
TSB +19, CTL 85 to 73 for a loss of about 13-14% (TSB still a bit high, but we'll see how well I acclimatise to the heat and humidity in Hawaii)

total
TSB = +31, CTL 129 to 113 for an overall loss of 12-13%

runPMCedit

bikePMCedit

Thursday 17 September 2009

Peaking and Tapering, Part II

In Part I, I talked about how (I felt) my taper wasn't quite right for Ironman Lake Placid. I've done more training hours, more consistent training, more intense training and more volume this year than in any year before, so my previous tried-and-true taper method also needed some reworking (it appears). For Ironman Hawaii, I'm going to be a bit stricter on myself in adhering to scheduled workouts in the last few weeks before the race -- both in the sense that I don't overdo it and I don't underdo it -- and hopefully I can have a better race day.

Ultimately, I want to use the Performance Management Chart (PMC) to plan my workouts to help me achieve two things by race day:
1) TBS of about +20
2) CTL loss of about 10% from its highest point.

To this end, the first thing I did was plug my proposed workouts for the next three weeks into SportTracks, along with their projected TSS values. Incidentally I find SportTracks with the Training Load plugin way easier than WKO+ to work with; the calendar makes sense, the notes field lets me add stuff seamlessly, and the general UI and feel of the software is so much more intuitive. And since I'm using TSS/TRIMP values to determine my training load and stress balance (the plugin by default uses HR), the PMC will look the same in WKO+ as in SportTracks -- just nicer. :)

I got my projected TSS values by looking at past similar workouts in WKO+. For instance, I know that a long ride of ~100km/4hrs at an intensity factor of .70 will give me about 200 TSS points. Similarly, an hour-long run including some mile repeats gives me a TSS of 100 or so. Swims I generally use one TSS point per minute, less if I swim easy and more if I swim hard.

Three weeks of workouts, including the final two weeks of peaking/tapering from my Endurance Nation plan, plugged into SportTracks gives me this for my PMC:

PMC
projected CTL/ATL for October 10, 2009

That's a CTL of 119 (down roughly 10% from a projected high of 131 on Sept. 29) and an ATL of 97 to give me a TSB of 22 the day before race day. The TSB is a bit high maybe. But it's also likely that my workouts will feel a bit harder once I get to Kona as I'll need to acclimatise a bit, so having a bit extra on the TSB should be fine. Interesting to compare it to my LP taper (the big drop leading up to July 26) and see how it drops off more gradually and with fewer ATL spikes until the final week.

It's an interesting balance, tapering to shed enough fatigue without losing too much fitness. The problem is, as TSB rises, CTL decreases which can mean more than 10% fitness loss on race day. So which one is more important, keeping to a no-more-than 10% fitness loss, or having a TSB of +20? I think this is probably a problem for most athletes who carry a high CTL: the higher your TSS/day (which is what CTL is), the more you have to do to maintain it. And the more severely you taper and cut your volume, the more CTL drops compared to its absolute highest.

The highly analytical article from Coggan describing the art and science behind the PMC is here, but in my view the most important sentence is this:
in the Performance Manager concept, an individual’s CTL (and the “composition” of the training resulting in that CTL – see more below) determines their performance potential (at least within limits), but their TSB influences their ability to fully express that potential. Their actual performance at any point in time will therefore depend on both their CTL and their TSB, but determining how much emphasis to accord to each is now a matter of trial-and-error/experience, not science.
But I think it's also important to keep in mind what ChuckieV has said about tapering and freshness (though I have to say he loses me with the "anyone training less than 15 hours a week only needs a few days of taper" bit!):
Quite often athletes erroneously aim for being "fresh" when Ironman day arrives, when they really just need to focus on being rested.
Rested is what I'm going to have to be to put on my best performance. That means early to bed every night, naps if I need them, limiting the time spent on my feet doing touristy things and generally staying away from the hustle and bustle of 2000+ other Ironman athletes stressing about their race.

Sunday 6 September 2009

Peaking and Tapering, Part I

Yesterday I had an enlightening moment reading Joe Friel's blog about Projecting Race Readiness. I had known that my IMLP taper wasn't right, that I had tapered too much and lost too much fitness, resulting in a less-than-ideal race performance, but hadn't really crunched the numbers to see how. I had followed the protocol of 70% of usual volume in the first week of taper, 50% in the second week, 30% in the third week. Still, I felt flat and underpowered on race day and terrible compared to last year at Ironman Germany where I had tapered so carefully and hit race day feeling great.

Two things stood out for me in particular from Joe's post:
1. Training Stress Balance (TSB, or CTL minus ATL) should be about +20 by race day.
2. Total loss of Chronic Training Load (CTL, aka fitness) should be kept to about 10%.

I had a look at my own Performance Management Chart from WKO+ and checked out the numbers. Sure enough, between my taper start date of July 5 and race date of July 26, my CTL (blue line) had gone from 133 to 112, a 15% drop. And my TSB (yellow line) was over 30, way too high! Ironically, being more "rested" through a lower ATL (red line, aka fatigue) and higher TSB is the very thing that helped me feel slow and tired and flat during the race.

Tapering is certainly part art, part science, and there are a lot of factors that could have affected my race day readiness in Lake Placid. But from studying my data below, I can see clearly now how my drastically reduced training load -- too much too soon -- nearly blew my race though a poorly-executed peak period and taper.

PMC
How not to peak/taper

In Part II I'll take a stab at describing what my peak period and taper for Kona should look like, and what I'll do differently to achieve it (and in doing so, hopefully achieve a better race day freshness than I did at Lake Placid).

If you're not familiar with WKO+ and all the terms I've used, here's a basic crash course.

Wednesday 2 September 2009

Of pointy hats and small cogs

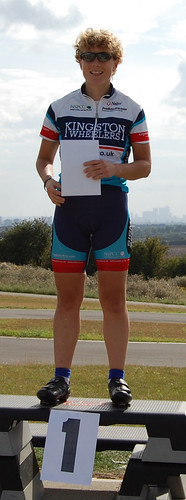
After a summer of trying out a few informal "club 10" time trials, I finally managed to complete something bigger on Monday: an open 50 mile TT on one of the fastest courses in the country. Over 100 riders took part, with the winner riding finishing in 1:40:50 (that's nearly 30mph!). I managed a respectable 2:05:43, which is 23.86mph or 38.4km/h, but still finished more than eight minutes behind the women's winner and only 6th out of the women's field. Still, I was satisfied with my performance as I managed to pace it fairly evenly (more about that below), with 1:02:57 for the first 25 miles and 24:42 for the last 10 miles. I'm hoping these numbers bode well for my open 10 mile TT in two weeks and 25 mile TT at the end of September. Not only are these TTs good training for Kona, but they'll give me good baseline times to improve next year, not to mention a shot at some trophies at the Kingston Wheelers awards dinner at the end of the year!

The data and discussion of my ride are below, but before I get into that, I thought I'd provide a newbie's point of view of time trialling in the UK. According to Wikipedia, it's quite an old sport, first beginning in 1895 and historically being held on the fastest roads available. Supposedly, races were held illicitly for many years as the highway code didn't allow any racing at all. Now it's a sport with a devoted following of early-risers (TTs often start at 6am) who squeeze every conceivable ounce of speed and aerodynamic advantage out of their equipment possible; I thought triathletes were bad, but TTers put them to shame! When I arrived at HQ, I was shocked at the number of bling frames, frighteningly low handlebars, disc wheels, aero helmets, tiny gear cogs and skinsuits all in one place. In fact, I felt rather out of place in my regular bike jersey and shorts (albeit the tightest-fitting I own), triathlon shoes, and a mere 60mm deep rear wheel with *gasp!* my everyday cassette on it. At least I had picked up an aero helmet at the last minute, so from far away I didn't look too out of place. But it's funny how a sport as old school and grassroots as time trialling -- where sleeveless shirts are not permitted but helmets are optional -- has at the same time the most flashy equipment and slick-looking riders. I didn't see anything like BBAR champ Nik Bowdler's bike (pictured below), but there were certainly a lot of huge chainrings and tiny cogs around!


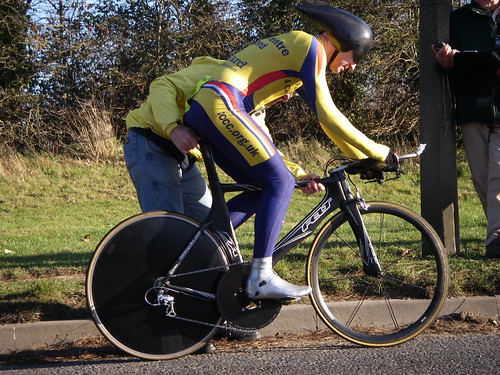
That's a 73 tooth chainring on the front!

My start time was 7:43am, but given the convoluted course instructions I figured I'd better get there early to drive it and make sure I knew where all the turns were. I needn't have worried, as the organisers had signed everything very well and placed marshals at every junction. Not a fun job to stand on the side of a divided highway and point an endless stream of cyclists in the right direction for hours on end -- at least in a road race you get to watch the attacks and breaks! -- but the volunteers were great, even cheering me on each time I passed their grim position. The weather turned out better than expected, as the chilly wind from the previous few days had died down considerably, leaving only a misty drizzly and warm morning. Later on the mist lifted and the roads dried up, and nearly all the top times were owned by vets, who started long after 8am and enjoyed extremely fast course conditions compared to the early starters.

I didn't really have a goal time in mind, but figured somewhere around 2 hours 5 minutes would be a good time for me in my first go at the 50 mile distance. After Googling around to try and figure out a good wattage number to aim for, I finally decided on ~215 watts, or ~95% of my test FTP on the TT bike: much harder than the 80-85% I'd target for a 56-mile half-Ironman bike leg, but not as all-out as a Richmond Park three-lap challenge. In fact, I had read that a good perceived effort for a 50 mile TT was more or less that of an Olympic triathlon (which lasts roughly the same amount of time), so I kept that in mind while I was out there.

According to Joe Friel, the third quarter of a TT is always the hardest, even if you hold back in the first half. Paced properly, the last quarter can be quite strong; paced badly, I would imagine it to be a complete sufferfest. Below is my power graph for the entire event, divided roughly into four quarters (and slightly smoothed for ease of viewing). Even though my VI is 1.01 -- nearly perfect for a more or less flat time trial -- it's apparent I didn't pace anywhere near perfectly.

50mileTT_graph
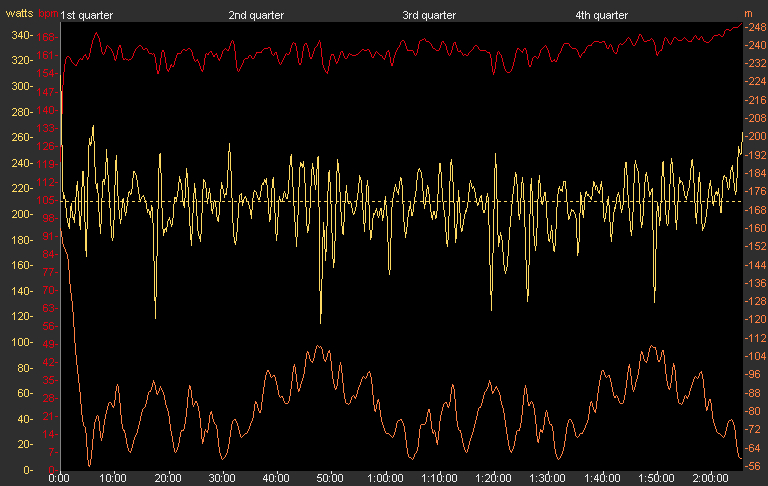
Heart rate is red, power is yellow, elevation is orange.

First quarter:
Duration:   30:59
Work: 392 kJ
TSS: 42.6 (intensity factor 0.908)
Norm Power: 213
VI: 1.01
Pw:HR: 5.18%
Pa:HR: -4.93%

I managed to go out a bit hard for the first 15 minutes or so. In fact, after the first five minutes when I realised that I forgot to switch my cassette from the hilly IMLP 12-25 to a more appropriate 11-23 for a flat time trial, I decided I'd better try and compensate the loss of speed and power on the downhills by going a tiny bit harder on the uphills (bad idea, next time just make sure to start with the proper cassette!)

Second quarter:

Duration: 32:02
Work: 400 kJ
TSS: 42.9 (intensity factor 0.897)
Norm Power: 211
VI: 1.01
Pw:HR: 4.71%
Pa:HR: -1.44%

I was expecting a headwind at any moment once I turned south again, 20 miles into the event, but it never seemed to come. In fact, the section between 20 and 25 miles felt the best of the whole day. Riding past the turn-off for the finish line, I started the second lap feeling pretty good.

Third quarter:
Duration:   31:48
Work: 387 kJ
TSS: 40.9 (intensity factor 0.878)
Norm Power: 206
VI: 1.02
Pw:HR: 4.46%
Pa:HR: -18.3%

Somewhere between 30 and 40 miles, I started to suffer, as my legs were really starting to hurt and I wondered how I could possibly do another 30 minutes at my current pace. It felt like my watts were really dropping (though it probably just seemed that way as I glanced at my powermeter probably at moments where I knew I was slacking off). I also started to lose focus a bit. Spending 90 minutes by myself, riding at the same pace, in the same position, on a boring straight highway with traffic roaring by was taking its toll mentally. In reality, I was only down a handful of watts, but at the time it felt like I was pedalling in molasses.

Fourth quarter:

Duration: 30:56
Work: 397 kJ
TSS: 43.4 (intensity factor 0.918)
Norm Power: 216
VI: 1.01
Pw:HR: -2.9%
Pa:HR: -5.96%

Thankfully in TTs the last 10 miles are counted down one by one; whether that's for added pacing assistance or just to motivate the riders to finish, I was overjoyed to see those markers. The final 5 miles seemed to go by more quickly than expected, so I guess I had more left in the tank than I thought. The final mile was downhill and with one eye on the clock, I was pretty sure I'd break 2:06 and I did. You're supposed to yell out your number to the timing official but I really had nothing left as I passed him. No doubt about it, I left nothing on the course and in fact had to pull over to eat something before I started the 15-minute easy ride back up the hill to HQ. A rider who finished just after me rode by and I couldn't even bring myself to make conversation, let alone join him. I was simply too spent.

Overall, I managed 1:02:57 for the first half and 1:02:46 for the second half, with 212 NP for each. Next time I'll make more an effort to hold back a little bit at the start, and be more mentally prepared for the draggy third quarter so my watts don't drop so much. Between that and some very needed aero improvements (as can be seen from the photo below!) I should be able to get a lot closer to 2 hours for 50 miles on a good day.

a3cgr_50_crop
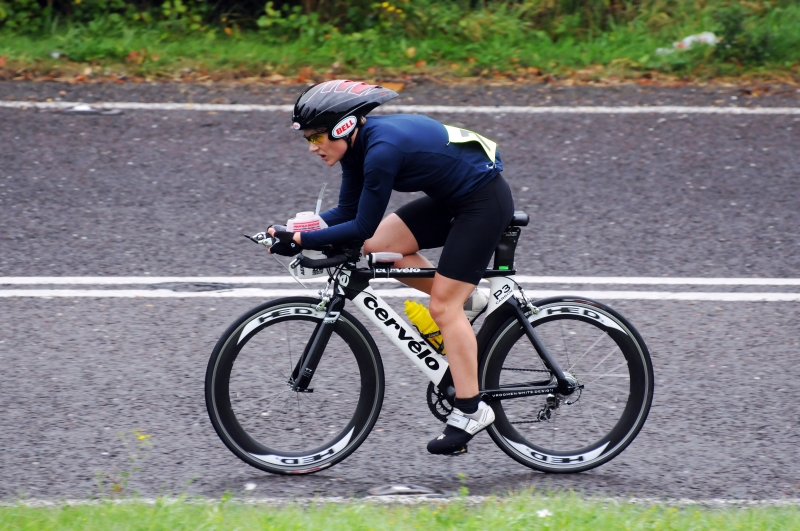
Copyright Charles Whitton Photography